
Havering's average home cost £448,648 in July, up £9,260 in a year while London fell 3.3%. Only three of the 33 boroughs grew faster; 21 went backwards.
The average home in Havering cost £448,648 in July 2026. That is £9,260, or 2.1%, more than it cost in July last year (HM Land Registry, UK House Price Index, published 16 September 2026).
London did the opposite. The capital’s average fell 3.3% over the same twelve months, to £550,037. Twenty-one of the 33 boroughs went backwards.
Havering was one of twelve that did not, and only three grew faster.
Where Havering sits in London
These are the boroughs where the average price rose most in the year to July 2026:
- Barking and Dagenham, up 5.3% to £375,604
- Kingston upon Thames, up 3.3% to £591,555
- Waltham Forest, up 2.8% to £529,102
- Havering, up 2.1% to £448,648
- Bexley, up 2.0% to £413,343
- Hounslow, up 1.7% to £525,435
The falls at the other end of the table are much steeper than the rises. The City of Westminster is down 20.8% on the year, the City of London 17.4%, Tower Hamlets 14.4% and Kensington and Chelsea 14.1%. That pattern, inner London falling hard while the outer east holds, is the same one the index showed in June.
Havering also beat the national figures. England rose 1.1% to £293,479 over the year and the UK 1.4% to £272,611.
The neighbours mostly fell
The interesting comparison is not with Kensington. It is with the places a Havering seller might actually move to, or compete with.
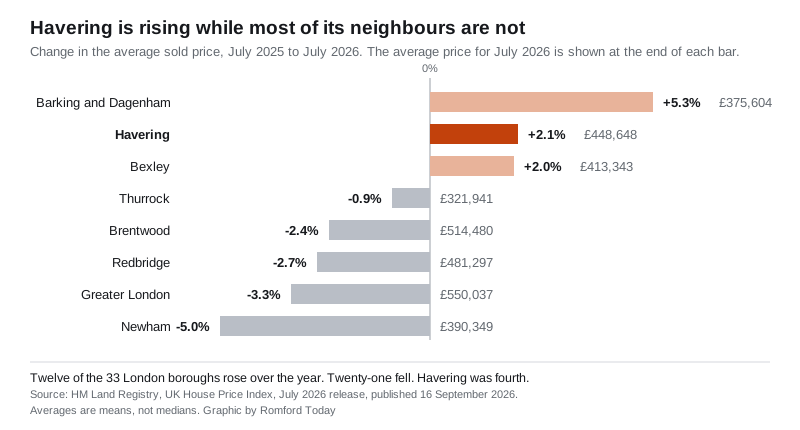
Redbridge, next door, has turned over. On the same data it was up 2.5% on the year in June and is down 2.7% in July, at £481,297. Brentwood, just over the Essex boundary, is down 2.4% to £514,480. Thurrock is down 0.9% to £321,941 and Newham down 5.0% to £390,349. Barking and Dagenham, still the cheapest borough in the comparison at £375,604, is the only one growing faster than Havering.
What is rising, and what is not
The borough average hides four different markets. Over the year to July 2026:
- semi-detached homes rose 3.1%, or £16,137, to £540,897
- terraced homes rose 2.7%, or £11,477, to £435,382
- detached homes rose 2.3%, or £18,886, to £841,116
- flats and maisonettes fell 0.7%, or £1,751, to £251,321
So the family housing that makes up most of Havering is pulling the average up, and the flat market is not. A first-time buyer paid an average of £388,533 in July, up £7,826 on a year earlier.
June’s record was quietly revised down
Last month we reported that Havering’s average had hit a record £456,759 in June, and that figure was correct as published. The same index now puts June at £452,498, which is £4,261 lower.
Nothing was sold and unsold. The UK House Price Index is built from Land Registry sales as they are registered, and the most recent months are revised each time a new release lands. It is worth knowing before anyone quotes a monthly figure as though it were settled.
Two things survive the revision:
- June 2026 is still the highest monthly average in a Havering series that runs back to January 1995, when it was £68,980.
- July’s £448,648 is the third highest, behind June and May.
July is therefore £3,850 below the peak rather than a new one. On a series this volatile, one month down is not a downturn, and we will say so if three of them line up.
One more caveat that matters when you compare this with an estate agent’s figure: UKHPI averages are means, not medians. A handful of expensive sales in Emerson Park or Cranham pulls the borough number up in a way a median would not.
How Havering compares on the price itself
Growth is one thing; the price on the board is another. In July 2026 the average Havering home was:
- £101,389 cheaper than the London average of £550,037, or 18.4% below it
- £155,169 dearer than the England average of £293,479
- £73,044 dearer than Barking and Dagenham and £32,649 cheaper than Redbridge
That is the borough’s usual position: comfortably under the capital, comfortably over the country, and priced between the two neighbours it competes with most for buyers moving out of inner London.
The next set of figures, for August 2026, is published at 9.30am on Wednesday 21 October 2026 (GOV.UK, UK House Price Index reports). It will also revise July.
What it means for you
- If you are selling, the market you are selling into is stronger than the London average by more than five percentage points on the year. That is unusual and it is concentrated in houses rather than flats.
- If you are buying a flat, you are the only group in Havering looking at prices lower than a year ago, by £1,751 on average.
- If you are getting a valuation, ask whether the comparable sales are means or medians, and for which month. The June figure quoted widely in August has since moved by over £4,000.
- If you are budgeting, the price band also drives your bill: our Havering council tax bands page has the 2026/27 figures for each band, and our Romford house prices page carries the street-level and property-type detail.
Sources
- HM Land Registry, UK House Price Index for Havering (the borough average, the split by property type, the first-time buyer average and the full series back to January 1995)
- GOV.UK: UK House Price Index for July 2026, published 16 September 2026 (the release date)
- Borough, London, England and UK figures were taken from the Land Registry’s open UKHPI data on 22 September 2026, one query per area. All averages are mean sold prices. Published under the Open Government Licence.
Have your say