
Havering logged 24,479 crimes and ASB reports in the year to July 2026, flat on last year. Rainham shoplifting tripled; Harold Wood burglary fell 64%.
Police recorded 24,479 crimes and anti-social behaviour reports across Havering in the 12 months to July 2026. That is 49 fewer than the year before, so the borough total barely moved.
Underneath that flat line, some wards changed sharply. Shoplifting in Rainham and Wennington ward more than tripled, from 90 reports to 282. Burglary in Harold Wood fell from 92 to 33.
These are our own counts from the Home Office’s police.uk open data, which maps every crime the Metropolitan Police records. We added up every report inside each of Havering’s 20 wards, using the ONS December 2024 ward boundaries, for the 24 months from August 2024 to July 2026. July 2026 is the newest month police.uk has published. Our ward totals add up exactly to a separate count across the whole borough boundary: 2,324 reports in July 2026 and 2,401 in July 2025.
What went up and what went down
Year to July 2026, compared with the year to July 2025, across the whole borough:
| Type | Year to July 2025 | Year to July 2026 | Change |
|---|---|---|---|
| Violence and sexual offences | 6,652 | 7,024 | up 5.6% |
| Anti-social behaviour | 5,104 | 5,265 | up 3.2% |
| Vehicle crime | 2,265 | 2,231 | down 1.5% |
| Shoplifting | 2,269 | 2,201 | down 3.0% |
| Other theft | 1,582 | 1,513 | down 4.4% |
| Public order | 1,348 | 1,398 | up 3.7% |
| Drugs | 1,294 | 1,229 | down 5.0% |
| Criminal damage and arson | 1,386 | 1,117 | down 19.4% |
| Burglary | 1,006 | 861 | down 14.4% |
| Robbery | 568 | 581 | up 2.3% |
| Theft from the person | 465 | 448 | down 3.7% |
| Other crime | 350 | 332 | down 5.1% |
| Possession of weapons | 117 | 182 | up 55.6% |
| Bicycle theft | 122 | 97 | down 20.5% |
| Total | 24,528 | 24,479 | down 0.2% |
Leave out anti-social behaviour and recorded crime fell by 1.1 per cent, from 19,424 to 19,214.
The good news is in property crime. Burglary fell by 145 reports and criminal damage by 269. Bicycle theft is down by a fifth.
Violence rose by 372 reports, the largest rise in numbers of any type. Weapons possession rose the fastest in percentage terms, but from a small base. Possession offences are mostly found by officers during searches rather than reported by the public, so a rise can reflect more searching as well as more weapons being carried.
Rainham: one supermarket point, three times the shoplifting
Rainham and Wennington went from 1,439 reports to 1,907, up 32.5 per cent. That is the biggest rise in numbers of any ward.
Shoplifting drives most of it. The ward recorded 90 shoplifting reports in the year to July 2025 and 282 in the year to July 2026. Of those 282, 275 sit at a single map point that police.uk labels “Supermarket”, near Rainham’s Broadway.
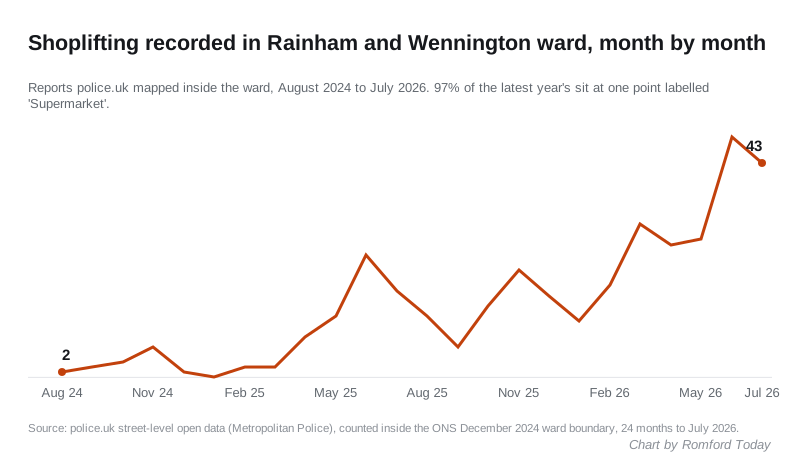
The monthly count was in single figures through the winter of 2024. It reached 25 in June 2025, then 31 in March 2026, 48 in June 2026 and 43 in July 2026.
police.uk deliberately moves each crime to the nearest of a set of anonymous map points, so the data does not name the shop. A rise this concentrated at one point usually means one store reporting more, which can come from more theft, a change in how the store reports it, or both. The figures alone cannot tell those apart.
Anti-social behaviour in the ward also rose, from 320 reports to 450, and violence from 367 to 431.
The other big moves
- Emerson Park: shoplifting rose from 19 to 82. All 82 are mapped to a single point on Wykeham Avenue.
- St Andrew’s: anti-social behaviour rose from 225 to 382, while shoplifting fell from 296 to 167.
- Rush Green and Crowlands: violence rose from 530 to 626.
- South Hornchurch: violence rose from 231 to 319, while anti-social behaviour fell from 268 to 212.
- Harold Wood: burglary fell from 92 to 33 and shoplifting from 188 to 112. The ward’s total fell 19.2 per cent, the largest fall in Havering.
- Mawneys: drugs offences fell from 121 to 57 and shoplifting from 210 to 144.
- St Edward’s, which covers central Romford: theft from the person fell from 226 to 155, but shoplifting rose from 473 to 610.
Every ward, ranked
All crime and anti-social behaviour reports mapped inside each ward:
| Ward | Year to July 2025 | Year to July 2026 | Change |
|---|---|---|---|
| St Edward’s | 3,431 | 3,456 | up 0.7% |
| Heaton | 2,183 | 1,959 | down 10.3% |
| Rainham and Wennington | 1,439 | 1,907 | up 32.5% |
| Rush Green and Crowlands | 1,596 | 1,711 | up 7.2% |
| Gooshays | 1,547 | 1,543 | down 0.3% |
| St Andrew’s | 1,389 | 1,494 | up 7.6% |
| Elm Park | 1,344 | 1,268 | down 5.7% |
| St Alban’s | 1,121 | 1,142 | up 1.9% |
| Havering-atte-Bower | 1,241 | 1,114 | down 10.2% |
| Mawneys | 1,273 | 1,087 | down 14.6% |
| South Hornchurch | 885 | 1,009 | up 14.0% |
| Squirrels Heath | 1,043 | 991 | down 5.0% |
| Harold Wood | 1,206 | 974 | down 19.2% |
| Hylands and Harrow Lodge | 976 | 949 | down 2.8% |
| Beam Park | 912 | 921 | up 1.0% |
| Upminster | 886 | 872 | down 1.6% |
| Marshalls and Rise Park | 750 | 613 | down 18.3% |
| Cranham | 553 | 539 | down 2.5% |
| Hacton | 374 | 506 | up 35.3% |
| Emerson Park | 379 | 424 | up 11.9% |
St Edward’s tops the table in both years because it holds the town centre and the market, where most people are at any one time. Hacton’s 35.3 per cent rise is the largest in percentage terms, but it comes from one of the smallest bases. Its anti-social behaviour reports almost doubled, from 84 to 158.
What it means for you
- Ward counts are not risk rates. A ward with a shopping centre or a big supermarket will always record more, because that is where people and goods are. Compare a ward with itself over time, not with its neighbours.
- Check your own street. Search your postcode on police.uk to see the monthly map and the local policing team for your area.
- Report it, even if it seems minor. These figures only count what is reported. You can report a crime online through the Metropolitan Police, or call 101. Always call 999 in an emergency.
- Shop workers: the rise in Rainham suggests at least one store is reporting far more often. If you run a smaller shop and do not report thefts, they never reach figures like these.
How we counted
police.uk publishes every crime the Metropolitan Police records, with a month, a type and an approximate location. We asked its crimes-street API for every report inside each of Havering’s 20 ward boundaries, month by month. We checked each record carried the month we asked for and that no record fell in two wards. Anti-social behaviour is included in the totals because police.uk counts it alongside crime; we show it separately in the first table. Records are mapped to the nearest anonymous point, so a small number near a ward edge may be counted in the ward next door.
Have your say