
Havering's average home hit a record £456,759 in June, up £17,264 in a year. Only Barking and Dagenham rose faster of the 33 London boroughs, and 19 fell.
The average home in Havering sold for £456,759 in June 2026. That is the highest figure the official index has ever recorded for the borough, and it is up £17,264, or 3.9%, on June last year (HM Land Registry, UK House Price Index).
The number that makes it a story is not the record. It is what the rest of London did in the same twelve months. London as a whole fell 2.5%, to £553,870. Nineteen of the 33 boroughs went backwards.
Havering did not. Of the 33, only Barking and Dagenham rose faster.
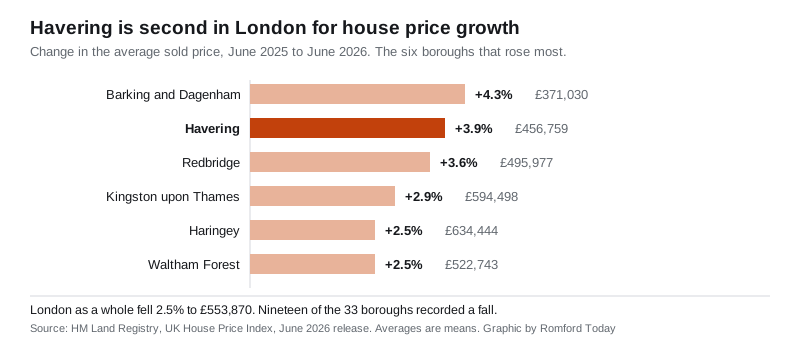
Havering is second in London for annual growth
These are the London boroughs where the average price rose most in the year to June 2026, from the Land Registry’s full UK HPI data file:
- Barking and Dagenham, up 4.3% to £371,030
- Havering, up 3.9% to £456,759
- Redbridge, up 3.6% to £495,977
- Kingston upon Thames, up 2.9% to £594,498
- Haringey, up 2.5% to £634,444
- Waltham Forest, up 2.5% to £522,743
The pattern is the outer east of the capital pulling away from the centre. The steepest falls in the same month were City of Westminster, down 25.4%, City of London, down 20.4%, and Kensington and Chelsea, down 14.7%.
England as a whole rose 1.8%, to £293,262. Havering beat that too.
The record, in context
June’s £456,759 is the highest monthly average in a Havering series that runs back to January 1995, when it was £68,980. The previous peak was £447,844 in November 2025. June beat it by £8,915.
Prices were flat through the winter. The borough average sat between £444,227 and £448,080 from November to April, then moved 1.4% in May and 0.5% in June.
Further back:
- June 2021: £388,625
- June 2016: £344,275
- June 2006: £212,490
What each type of home costs
The borough average hides a wide spread. These are the June 2026 figures for Havering, with the change on the year:
| Property type | Average price | Change on the year |
|---|---|---|
| Detached | £855,039 | up 3.1% |
| Semi-detached | £550,821 | up 4.7% |
| Terraced | £442,800 | up 4.7% |
| Flat | £256,449 | up 1.8% |
Semis and terraces did the work. Those are the streets most of the borough actually lives on, from Collier Row to Elm Park. Flats, which is where a lot of Romford town centre’s new supply sits, moved barely at all.
The average paid by a first-time buyer in Havering was £395,466, up 4.1% on the year.
What it means for you
If you are selling. The index says a Havering semi is worth about £24,700 more than it was in June 2025. That is the borough average, not your street, and it is a mean rather than a median, so a handful of very large sales pull it up. Check what has actually completed near you before setting a price.
If you are buying. The gap between a Havering terrace at £442,800 and a Havering flat at £256,449 is now £186,351. First-time buyers priced out of houses are looking at a flat market that rose 1.8% in a year, well behind the houses above it.
If you are comparing boroughs. Barking and Dagenham remains far cheaper at £371,030, and it is rising faster. Redbridge is £39,218 dearer than Havering and rising at almost the same rate.
If you are working out running costs. Sale price is only half of it. Our Havering council tax bands page sets out what each band costs in 2026/27, and our Romford house prices page covers the town rather than the whole borough.
Two things to know about these figures
The UK House Price Index is a mean average, not a median. It is worked out from sales that have completed and been registered, so it reflects deals agreed several weeks or months earlier. It is not an asking-price survey.
Recent months get revised. Havering’s May 2026 average was first published as £452,798, an annual rise of 2.8%. The June release revises May up to £454,292 and 3.2%, a change of £1,494. The Land Registry keeps adding late registrations to a month after publishing it, so the newest figure is always provisional.
Sales volumes lag further still. The most recent month with a published count for Havering is April 2026, at 169 sales, after 209 in March and 224 in February. May and June are blank in the June release and will be filled in later.
Update, 22 September 2026: June has been revised down
The figures above are the ones the Land Registry published in its June 2026 release, and they were correct as published. The July 2026 release, out on 16 September, revises June’s Havering average down to £452,498, which is £4,261 lower than the £456,759 reported here, and its annual rise to 3.0% rather than 3.9%. June remains the highest month in the borough’s series. Nothing else on this page changes.
The July figures, and where Havering now sits among the 33 London boroughs, are in our report on the July release.
Have your say