
Havering's claimant count rose 300 in September to a provisional 7,855, level with September 2021. Under-25s rose most; London and England rose too.
7,855 people in Havering were claiming benefits mainly because they were out of work in September. That is 300 more than in August.
The figure is provisional. If it holds, it matches September 2021 and is the highest of any month since August 2021.
The figures are the Office for National Statistics claimant count, published through nomis on 20 October. The ONS revises the latest month a month later, so September could still move.
The claimants make up 4.6% of Havering residents aged 16 to 64, up from 4.4% in August. A year ago, in September 2025, the count was 7,605. So the borough is up 250 on the year, and almost all of that came in a single month.
A much bigger September rise than usual
Septembers usually move the count a little. This one did not.
| September | Change on August |
|---|---|
| 2024 | up 35 (7,630 to 7,665) |
| 2025 | up 55 (7,550 to 7,605) |
| 2026 | up 300 (7,555 to 7,855) |
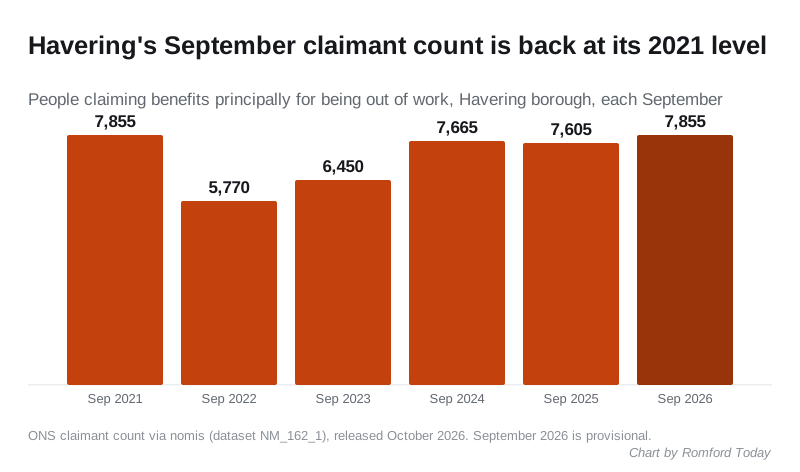
The chart shows how far the count has come. It fell to 5,770 in September 2022 as the borough recovered from the pandemic. Since then it has climbed back, and this September it matched September 2021 exactly.
Under-25s rose fastest
The rise was spread across every age group. Two groups stand out.
| Age group | September 2025 | August 2026 | September 2026 |
|---|---|---|---|
| 16 to 24 | 1,295 | 1,345 | 1,440 |
| 25 to 49 | 4,585 | 4,395 | 4,565 |
| 50 and over | 1,720 | 1,815 | 1,850 |
| All aged 16+ | 7,605 | 7,555 | 7,855 |
The age bands are rounded to the nearest five at source, so they do not always add up exactly to the total.
- Under-25s: 1,440 claimants, up 95 in a month and 145 in a year, an 11% rise. That is the sharpest growth of any age group.
- Over-50s: 1,850 claimants, up 130 in a year. This group has climbed almost every month this year, from 1,750 in January.
- 25 to 49: up 170 on August, but slightly down on a year ago.
Men and women rose by similar amounts. Male claimants went from 3,940 in August to 4,080, and female claimants from 3,615 to 3,775.
London and England rose too
Havering was not alone. The count rose across London and the country in September, though Havering’s rise was steeper.
| Area | August 2026 | September 2026 | Rise | Rate, Sept |
|---|---|---|---|---|
| Havering | 7,555 | 7,855 | 4.0% | 4.6% |
| London | 340,095 | 350,280 | 3.0% | 5.6% |
| England | 1,459,205 | 1,493,875 | 2.4% | 4.1% |
Havering’s rate is still below London’s 5.6%. It is well below its neighbours to the west, Barking and Dagenham (7.5%) and Redbridge (6.0%). Across the Essex border, Thurrock’s rate is 4.4% and Brentwood’s 2.5%.
A note on August’s figure
When we reported August’s count last month, the ONS put it at 7,705. It has since revised that to 7,555. The claimant count’s latest month is always provisional and is revised a month later. All comparisons with August in this story use the revised figure.
What the count measures
The claimant count includes people on Jobseeker’s Allowance and people on Universal Credit who are required to look for work. Some of them have a job but earn too little to come off the benefit. It is not the same as the unemployment rate, which comes from a survey and is not published for single boroughs each month.
What it means for you
- If you are looking for work in Havering, the council’s free Havering Works service offers one-to-one help from an employment specialist, CV building and interview preparation.
- If you are under 25, the rise in claims among your age group is the sharpest in the borough. Havering Works also supports residents moving into training, not only into work.
- If you are reading this as a sign of the local economy, one month is a warning rather than a trend. A provisional figure can move when it is revised. If October is also high, the change is real.
For the rest of the household picture, our Romford house prices page tracks the Land Registry figures for the borough.
Sources
- ONS claimant count by sex and age, via nomis, table NM_162_1, updated 20 October 2026: Havering’s monthly series from 2021, the age and sex splits for September 2025, August 2026 and September 2026, and the counts and rates for London, England, Redbridge, Barking and Dagenham, Thurrock and Brentwood
- ONS: Claimant Count Quality and Methodology Information (what the count measures and the revision of the latest month)
- Havering Council: Havering Works
Have your say