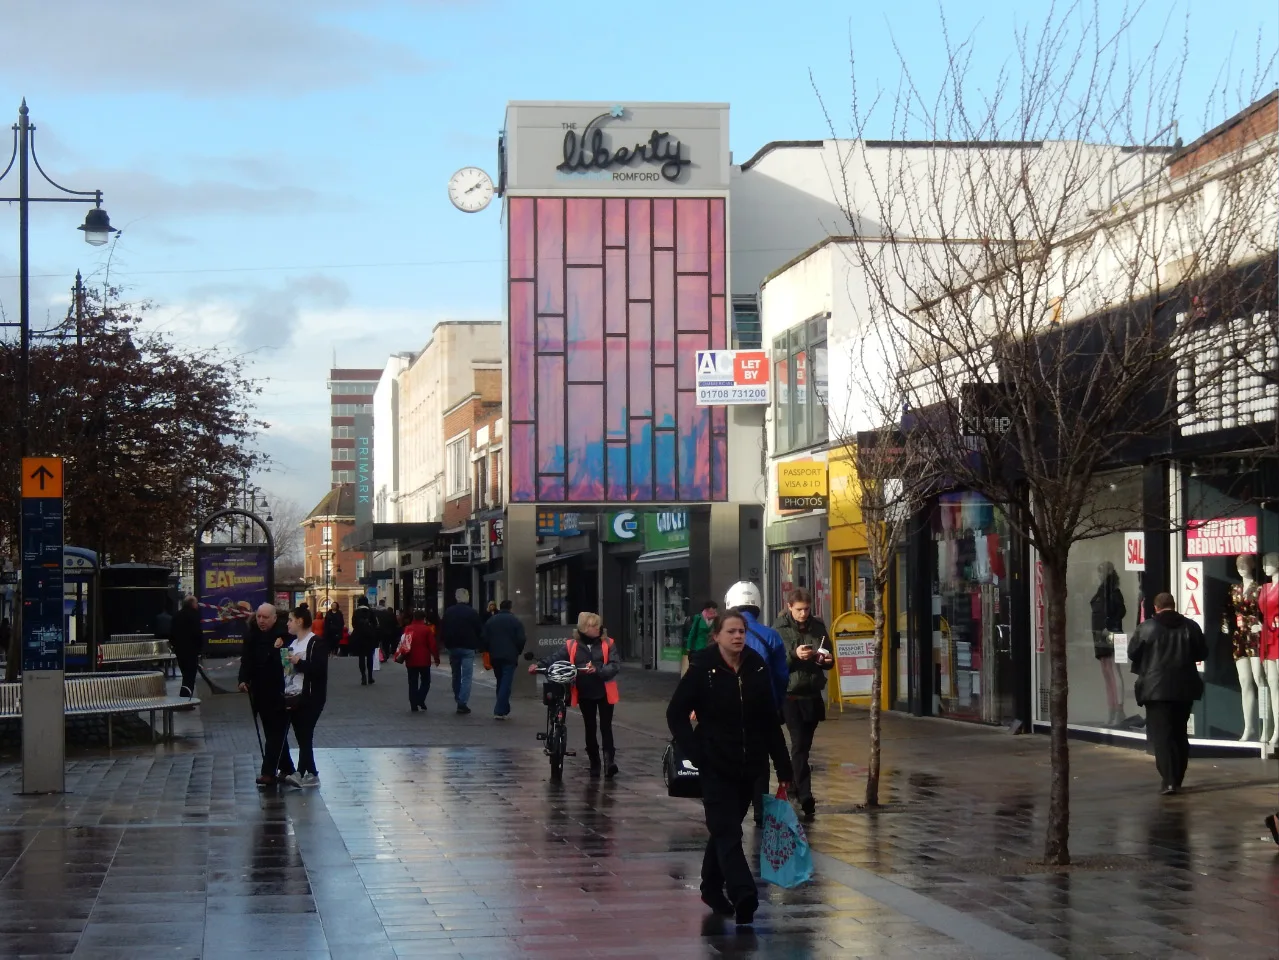

Havering's claimant count rose to 7,705 in August, the highest since June 2025. The entire year-on-year rise is among people aged 50 and over.
The number of people in Havering claiming benefits principally because they are out of work rose to 7,705 in August, the highest monthly figure the borough has recorded since June 2025.
That is up 105 on July and up 155 on August last year. The figures come from the Office for National Statistics claimant count, released through nomis on 15 September.
One number explains the whole increase. Between August 2025 and August 2026 the count of claimants aged 50 and over in Havering rose by 155, from 1,690 to 1,845. Over the same twelve months the 25 to 49 group, by far the largest, went down.
The year in three age groups
| Age group | August 2025 | August 2026 | Change |
|---|---|---|---|
| 16 to 24 | 1,300 | 1,370 | up 70 |
| 25 to 49 | 4,555 | 4,490 | down 65 |
| 50 and over | 1,690 | 1,845 | up 155 |
| All aged 16+ | 7,550 | 7,705 | up 155 |
The bands are rounded to the nearest five at source, so they do not add exactly to the total.
In proportional terms the over-50s group grew by about 9 per cent in a year and the under-25s by about 5 per cent, while the 25 to 49 band fell by about 1 per cent. The borough’s total went up by 155 in a year, but who is claiming changed by more than that headline suggests.
How Havering compares
The claimant count is also published as a share of residents aged 16 to 64. Havering’s is 4.5 per cent, against 5.5 per cent across London and 3.9 per cent across the United Kingdom.
That puts the borough in the better half of the capital, but only just. Nine of the 33 London boroughs have a lower rate, and Havering is level with Merton on 4.5 per cent. The lowest outside the City of London is Richmond upon Thames at 2.6 per cent. The highest are Newham, Haringey and Barking and Dagenham, all at 7.4 per cent.
A year ago Havering’s rate was 4.4 per cent, so the borough has drifted up by a tenth of a percentage point while the count rose by 155 people.
What this number is, and what it is not
This is the single most misquoted local statistic, so it is worth being precise. The ONS is blunt about it in its own quality report:
The Claimant Count does not attempt to measure unemployment, which is a concept defined by the International Labour Organisation (ILO) as all those who are out of work, actively seeking work and available to start work.
It is instead “a measure of the number of people claiming benefits principally for the reason of being unemployed, based on administrative data from the benefits system”. Three consequences follow, all set out by the ONS:
- Some people out of work are missing from it. Those in full-time education, those over state pension age, and people looking only for part-time work are generally not eligible.
- Some people in work are counted in it. The ONS notes that “some part-time workers, with very low earnings, may be eligible while seeking full-time work”.
- The count is therefore much lower than the true unemployment level, but the gap is reasonably stable, which is what makes it useful for comparing places and tracking a trend.
One more caution. The Universal Credit element of the count can be revised for one previous month, so the most recent figure in any release is the one most likely to change. July 2026 currently stands at 7,600.
What it means for you
- If you are looking for work in Havering, the council runs a free employment and skills service, Havering Works. It offers one-to-one support from an Employment Specialist, CV building, interview preparation and matching of transferable skills to vacancies, for residents starting work, returning to work or moving into training.
- If you are out of work and not currently job searching, Havering Works also runs Trailblazers, a Department for Work and Pensions funded programme for economically inactive residents facing barriers such as a health condition, a disability or caring responsibilities.
- If you are reading this as a measure of the local economy, treat it as a trend rather than a level. Havering has sat between 7,350 and 7,765 every month for more than two years. August is at the top of that band, not outside it.
The next release, covering September 2026, is due on 20 October.
For the other half of the household-finances picture, our Romford house prices page tracks the Land Registry figures for the borough, and our report on the £6.75m the government has just allocated to Havering covers the council’s side of the same squeeze.
Sources
- ONS claimant count by sex and age, via nomis, table NM_162_1, August 2026 release, published 15 September 2026: the monthly series for Havering from July 2024, the 16 to 24, 25 to 49 and 50 and over splits for August 2025 and August 2026, the rate for Havering, London and the United Kingdom, and the rates for all 33 London boroughs
- ONS: Claimant Count Quality and Methodology Information (what the count measures, who is excluded, the part-time low earners who are included, and the one-month revision rule)
- Havering Council: Havering Works (the service description and the Trailblazers programme)
Have your say